For a long time, hardware was the biggest restriction we faced when trying to squeeze performance out of our software, especially when writing I/O bound software such as server applications. If we go back ten years, such applications would by far spend most of its time waiting for sockets or disks to become ready for work, especially when bound by 10 Mbit/s uplinks and 5,400 RPM disks. The result? We could be lazy. There was so little to be gained from optimizing the rest of the application code, unless it was really compute intensive, that it really wasn’t worth it.
Times have changed though. Nowadays, any data center setup that has had a little bit of money poured into it features 10 Gbit/s ethernet uplinks and SANs that aggregate disk I/O of 15,000 RPM SAS disks to give you an I/O capacity of thousands of operations per second (or tens or even hundred of thousands, if you’re one of those lucky bastards who has a disk shelf stuffed with enterprise SSDs.) Furthermore, even Android phones now sport multi core processors, and mid-range servers regularly have 12 or 16 cores available for the grunt work. The result? Code is now the bottleneck.
A first world problem
I’ve spent a lot of the last half year working on/off on a piece of software, where this is definitely true. At 23 we’ve opted for building and running our own content distribution network rather than relying on third party vendors for reasons that I’ll discuss some other time. When designing the system, one of the goals was to moderate costs of operation by making sure that a single distribution node didn’t need a crapload of RAM to perform decently. The result is an infrastructure centered around a disk persistent, HTTP based caching server that acts as an easy interface for caching relatively large amounts of data. Needless to say, to saturate a 10 Gbit/s uplink with relatively small objects, your software can’t spend a whole lot of time being slow, so it was absolutely key to keep every part of the code as fast as possible while designing and developing the software.
Performance of what is essentially just an HTTP server is relatively easy to test as a whole. Simply set up the server with the configuration and data you want to test against in the given scenario, fire it up and point your favorite HTTP benchmarking tool at it. But, when things are not as fast as you’d expect, it’s actually really hard to find the source of the problem — did we hit some performance limit in the OS, are the disks overloaded, do we have a bug in the code, or, even worse, is the code just plain slow?
Unit testing has become a de facto standard in our industry, and I’ve been very happy with adopting it for this project, as I’m easily able to rule out most bugs in the code — if there is a bug, it’s probably my own logic that’s the problem, not the code itself. Unit testing does however not provide us with a clear picture of just how fast our code actually is, even though some frameworks do hint at the execution time of a single test, so it’s not really useful for figuring out if and what code is slow.
Last week I ran into a problem, where I actually needed to know how fast pieces was executing, and even though a bit of C++ code like below can easily handle this for simple scenarios, consistently checking performance was becoming a greater and greater pain in my ass as I was trying to optimize my way out of the problem, not to mention that it looked like crap to have this sprinkled all over my code.
struct timeval timeStart,
                timeEnd;
gettimeofday(&timeStart, NULL);

// Slow code goes here.

gettimeofday(&timeEnd, NULL);

std::cout << "This effing slow piece of code took "
          << ((timeEnd.tv_sec - timeStart.tv_sec) * 1000000 + timeEnd.tv_usec - timeStart.tv_usec))
          << " us to execute."
          << std::endl;
After a few hours of working like this, I finally decided to draw some inspiration from the testing guys. When writing tests, you start out by testing the smallest bits of your code in a lot of little unit tests and the proceed to testing the larger and larger spans of the code as a whole in integration tests. The following two examples illustrate the process pretty well with the first being a unit test of the constructor of the class Workspace and the latter being an integration test of the classes Workspace and Consumer:
TEST(Workspace, Constructor_SizePositive_Succeeds)
{
    ASSERT_NO_THROW({
        Workspace someWorkspace(1024);
    });
}

..

TEST(Consumer, Constructor_WorkspaceValid_Succeeds)
{
    ASSERT_NO_THROW({
        Workspace someWorkspace(1024);
        Consumer someConsumer(someWorkspace);
    })
}
Some might recognize the syntax, as it’s the way you write tests using Google’s excellent C++ testing framework, googletest. I decided to adopt this approach; knowing exactly how fast each of the little bits of your code is, and how fast they are when acting together, provides a lot of knowledge for debugging performance problems without cluttering your actual code with more or less beautiful profiling snippets.
A solution — or close enough
The result is a simple C++ benchmarking framework called hayai (it’s what Google translates “fast” to in Japanese.) You can find the source code on GitHub. If you’re familiar with the googletest framework, you should feel right at home using hayai — in fact, the code for the framework is heavily inspired by googletest in its current incarnation, so even extending it should be an easy ordeal.
Benchmarking a piece of code works much in the same way as with googletest. Let’s say we want to benchmark a simple function called DeliverPackage of the class DeliveryMan to see how well it fairs. The benchmarking code looks like the following:
#include <hayai.hpp>
#include "delivery_man.hpp"

BENCHMARK(DeliveryMan, DeliverPackage, 10, 100)
{
    DeliveryMan(1).DeliverPackage(100);
}
The benchmark is set up using the BENCHMARK macro originating from hayai.hpp in the hayai source code directory, which takes four parameters. The first is a contextual name of the benchmark, just like when using the TEST macro in googletest, while the second parameter is the name of a specific benchmarking test. The third and fourth parameters specify the number of runs and iterations to perform. A run is the execution of the code in the brackets performed iterations number of times. The purpose of this structure is twofold; code is often fast enough that resolution of the performance data on a single call simply isn’t good enough, which is why aggregating performance numbers across a number of iterations makes sense. Furthermore, code rarely executes at a fixed speed, so to properly understand the performance of your code, it’s useful to run the iterations a number of times to gather data about deviations in execution speed.
To actually run the benchmark, you just have to provide a simple main function like so:
#include <hayai.hpp>

int main()
{
    hayai::ConsoleOutputter consoleOutputter;

    hayai::Benchmarker::AddOutputter(consoleOutputter);
    hayai::Benchmarker::RunAllTests();
    return 0;
}
… or, if you’re really lazy, you can simply build the source in the hayai source code folder and link against the hayai_main library, which contains a main function just like the above.
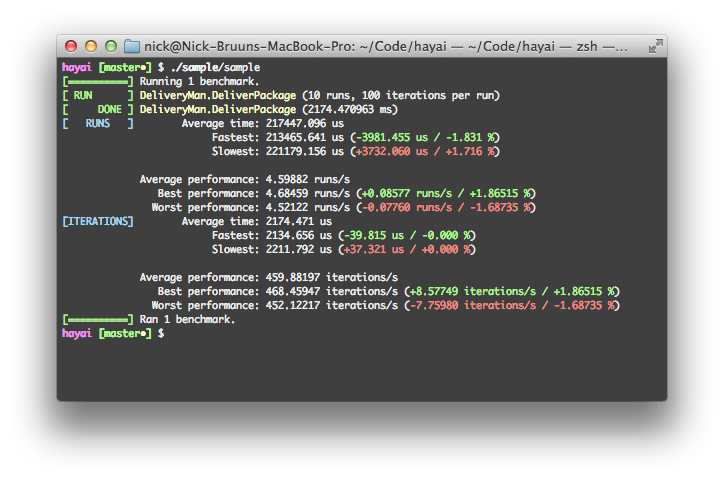
If we run the benchmark above, the output will look like the following:

The hayai framework outputs a series of numbers that tell us a little bit about how fast the code is executing. The first block contains aggregated information about all the runs like the average execution time for a run, the fastest and slowest runs, and the equivalent performance per second of this range. The second block provides the exact same information, just on a per iteration basis.
This is all fine for simple benchmarks, but sometimes it’s beneficial to be able to set up some code before we actually perform our iterations. In unit testing, the common approach to this is using so called fixtures, and hayai provides the exact same facility. A fixture is created for every run, and before the iterations begin, the virtual function SetUp() is invoked, and once the iterations for the run have been completed, the function TearDown() is invoked. The upside to this is, that profiling is only done across the iterations, so costly setup and teardown does not count in the benchmark, which has a lot of uses. An example of using a simple fixture looks like the following:
#include <hayai.hpp>

#include "delivery_man.hpp"

class SlowDeliveryManFixture
    :   public ::hayai::Fixture
{
public:
    virtual void SetUp()
    {
        this->SlowDeliveryMan = new DeliveryMan(1);
    }

    virtual void TearDown()
    {
        delete this->SlowDeliveryMan;
    }

    DeliveryMan* SlowDeliveryMan;
};

BENCHMARK_F(SlowDeliveryManFixture, DeliverPackage, 10, 100)
{
    SlowDeliveryMan->DeliverPackage(10);
}
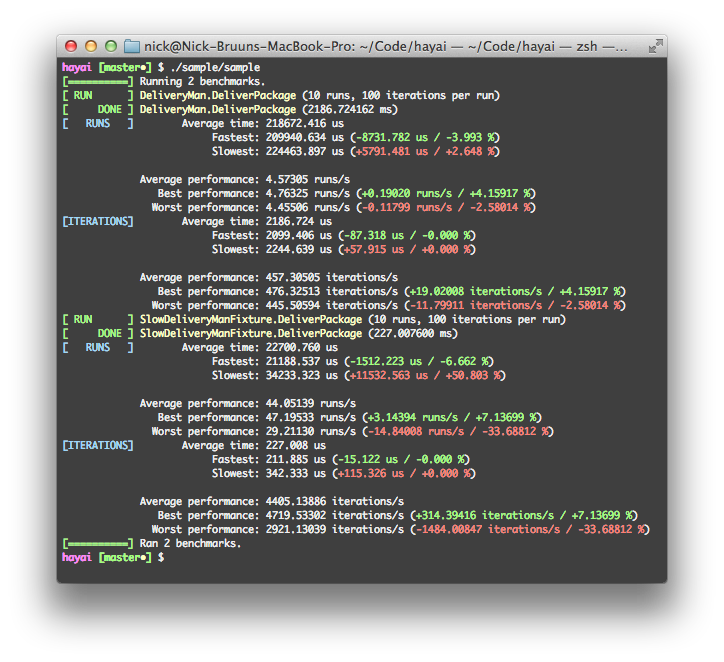
Just like in googletest, fixture based benchmarks are created using the BENCHMARK_F macro rather than the default BENCHMARK, and the first parameter needs to be the class name of the fixture rather than just a contextual description. With the two benchmarks combined, the output when running the benchmarks looks like this:

Give it a go
The above primer should let you implement some pretty simple benchmarks for some of your code (the sample code is in the sample/ directory in the repository), so I hope this is of at least some use to some people — combined with callgrind it has at least solved quite a few mysteries for me in the last week. I would love to start seeing people implement benchmarks as a part of distributing larger code bases, so for example problems imposed by system calls of varying performance on different systems will become a lot easier to deal with in the future.
Currently the code is not super-portable, but it should work on any relatively modern POSIX-compliant system with a GCC compiler. If you feel like it, you’re more than welcome to inform me of errors in the code, and fork the code to help test it on and port it to other systems and compilers.
In the future I’ll be adding a few simple things like optional distribution graphing, which will be very powerful in some cases where sporadic performance behavior occurs.